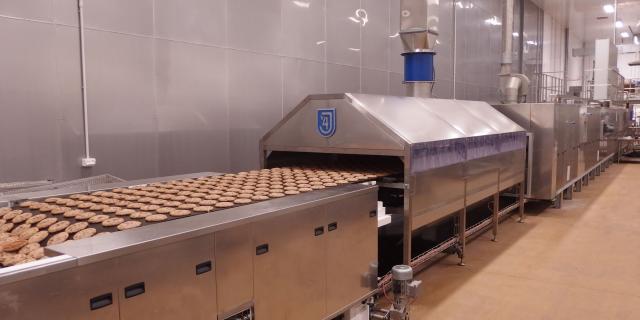
Gas has been and continues to be the predominant fuel for biscuit baking ovens. The development and availability of natural gas supplies have made gas the main fuel for the baking industry throughout the world. Countries where electricity was the main energy source, for example, China and countries where diesel oil was used for example India and the Middle East now use gas as the lowest cost energy source.
The combustion of natural gas is a major source of greenhouse gases which are causing climate change. This has become a major concern throughout the world. This situation makes it essential that we seek ways to reduce the carbon footprint of the biscuit baking industry.
The combustion process is a reaction of rapid oxidisation started by the correct mixture of fuel, oxygen, and an ignition source. In order for complete combustion of natural gas, excess air is supplied.
The chemical reaction for natural gas combustion with 20% excess air is:
CH4 + 1.20 x 2(O2 + 3.76 N2) -> CO2 + 2 H2O + 0.5 O2 + 9.4 N2
Where:
CH4 = natural gas
O2 = oxygen
N2 = nitrogen
2H2O = water vapour
CO2 = Carbon Dioxide
Ref. Engineering Toolbox
Air is composed of 20.9% of oxygen, 78% of nitrogen, and 1% of other gases. For most applications, every 1 m3 of natural gas, approximately 10 m3 of air is required to provide complete combustion of natural gas. To ensure complete combustion of the fuel, excess air is drawn in by the burners. The combustion efficiency will increase with increased excess air until the heat loss in the excess air is larger than the heat provided by more efficient combustion.
When fuel and oxygen in the air are in perfectly balance and the fuel is burned completely, the combustion is said to be stoichiometric. Typical excess air to achieve the best efficiency for combustion is 10-20%.
Carbon dioxide is a product of the combustion and the content in the flue gas is an important indication of the combustion efficiency. The content of carbon dioxide after combustion with excess air is approximately 10.5% for natural gas and approximately 13% for light fuel oils.
FIG.1 Stoichiometric combustion
Ref. engineeringtoolbox.com/ /stoichiometric-combustion-d_399.html
To calculate the Carbon Dioxide (CO2) emission from a fuel, the carbon content of the fuel must be multiplied with the ratio of molecular weight of CO2 (44) to the molecular weight of Carbon (12) -> 44 / 12 = 3.7
Carbon Dioxide emission from burning a fuel can be calculated as qCO2 = cf / hf MCO2 /Mm
Where:
qCO2 = specific CO2 emission [kgCO2/kWh]
cf = specific carbon content in the fuel [kgC/kgfuel]
hf = specific energy content in the fuel [kWh/kgfuel]
MC = Molecular weight Carbon [kg/kmol Carbon]
MCO2 = Molecular weight Carbon Dioxide [kg/kmol CO2]
Emission of CO2 from methane, natural gas is given below:
Specific carbon content: kgc / kg fuel | 0.75 |
Specific energy content: kWh / kg fuel | 15.4 |
Specific CO2 emission kgco2 / kg fuel | 2.75 |
(amount of fuel basis) | |
Specific CO2 emission kgco2 / kWh | 0.18 |
(amount of energy basis) |
Note Heat loss - 55-75% - in power generation is not included in the numbers.
Reference: Engineering Toolbox Combustion of fuels – carbon dioxide emissions
www.engineeringtoolbox.com/co2-emission-fuels-d_1085html
Greenhouse gases in the atmosphere absorb heat energy from the sun and emit it, keeping the earth’s surface and lower atmosphere warm. Greenhouse gases include carbon dioxide, water vapour, methane and nitrous oxide. The biggest contributor to the warming of the climate is carbon dioxide, CO2. Since pre-industrial times the atmospheric concentration of CO2 has increased by over 40% and methane by over 150%. More than half of this increase has occurred since 1970.
Methane is an important greenhouse gas which leaks during industrial processes, particularly fossil fuel use and distribution and agriculture. Work on reducing air pollution is valuable and can lead to lasting cuts in methane emissions.
Water vapour is also a potent greenhouse gas, but it has a short lifetime and is an amplifier, not a driver of climate change.
Human activities currently emit an estimated 10 billion tonnes of carbon each year, mostly by burning fossil fuels.
Reference: The Royal Society: www.royalsociety.org
The biscuit industry now uses gas as the fuel for baking in almost every country. Natural gas is now widely available and economic. However, this gives our industry a large carbon footprint. It will attract pressure in many countries to reduce the use of gas, by using electricity from renewable sources and improving efficiency.
Efficiency can be improved by:
The table below indicates some typical values for energy usage for baking.
Product type |
|
Energy for baking kWh/kg (excluding oven losses) |
Energy for baking kWh/kg (including est. losses) |
Short dough biscuits |
|
0.2121 |
0.404 |
Semi-sweet biscuits |
|
0.2502 |
0.477 |
Crackers |
|
0.3402 |
0.646 |
Note: 1 From actual installation
Note: 2 From calculations see Chapter 20
Density: | 0.68 kg/m3 |
Density at baking temperature | 0.4 kg/m3 |
Heat value of burning natural gas (methane): | 42 - 55 MJ/kg (11.6 – 15.3 kWh/kg ) |
Average energy per kg of gas: | 13.45 kWh/kg |
The calorific value, density, and energy for natural gas vary with the source, process, and delivery. The values above are from the sources listed under references.
Energy usage | kWh/kg | Natural gas consumption for baking one tonne of biscuits |
Short dough biscuits | 0.404 kWh/kg | 30.0kg of gas |
Semi-sweet biscuits | 0.477 kWh/kg | 35.5kg of gas |
Crackers | 0. 646 kWh/kg | 48.0kg of gas |
Average power requirement per tonne of product range 509 kWh
Average gas consumption per tonne 37.8 kg
The combustion of 1.0kg of natural gas produces 2.75kg of CO2 and 0.18 kWh of energy. www.engineeringtoolbox.com
The average production of CO2 for one tonne of product range (short dough / semi-sweet, cracker) is: 37.8 x 2.75 = 104 kg
CO2 emissions: 104 kg per tonne of the product range
A bakery with 3 production lines producing a total of 50 tonnes per 8-hour shift and 20 shifts a week will produce approximately 1000 tonnes of biscuits per week.
The CO2 emissions will be approximately 104,000 T per week and over 5,200,000 T per year.
Biscuit consumption and CO2 emissions in several countries
In these countries, the total population of 2327 million produce 960500 T of CO2 emissions each year from biscuit production. Per capita emissions: 0.413 kg/year
The total global CO2 emissions in 2016: 35,753,305,000 T.
The world population is 7.46 billion. Per capita CO2 emissions: 4.79 T
www.worldometers.info/co2-emissions
The current energy source for biscuit baking worldwide is gas. The option in some countries is fuel oil. However oil has a higher CO2 emission rate than gas, 3.15 kgco2/kg fuel compared to 2.75 kgco2/kgfuel for gas.
Electricity has substantial advantages for baking, but currently is expensive and the main generation systems involve substantial CO2 emissions. Fossil fuels have been the cheapest source of power for generating electricity. However, burning fossil fuels for generating electricity and heat is the largest source of greenhouse gases, causing 30% of global emissions.
The concern over climate change and the urgent need to reduce carbon emissions has led to the rapid development of renewable energy sources, solar, hydropower, wind, and biomass. In addition, nuclear power is an important source for the generation of electricity. The methods of the generation of electricity have changed during the last 10 years and now energy from some renewables is less costly than energy from new fossil fuel sources.
LCOE (Levelised costs of energy): based on the cost of building the power plant and the costs of fuel and operation during the plants lifetime.
USD/MWh | 2009 | 2019 |
Solar photovoltaic | 359 | 40 |
Solar thermal tower | 168 | 141 |
Nuclear | 123 | 155 |
Onshore wind | 135 | 41 |
Coal | 111 | 109 |
Gas peaker | 275 | 175 |
Gas | 83 | 56 |
Electricity costs from solar fell 13% year-on-year reaching USD 0.068 / kWh in 2019. Onshore and offshore wind costs fell about 9% year on year to USD 0.053 / kWh and USD 0.115 / kWh respectively for newly commissioned projects.
Renewables made up 26.2% of global electricity generation in 2018. It is expected to rise to 45% by 2040. Over half of all utility-scale renewable capacity additions in 2019 achieved lower costs than the cheapest equivalent new coal plant.
www.c2es.org
www.energypost.eu
USD/kWh | 2010 | 2021 |
Solar photovoltaic | 0.37 | 0.05 |
Solar CSP | 0.35 | 0.07 |
Offshore wind | 0.16 | 0.13 |
Onshore wind | 0.08 | 0.05 |
The price of generation from onshore wind and solar PV-generated power have both fallen below USD 0.05 / kWh. Fossil fuel-powered generation usually costs between USD 0.05/kWh and 0.18/kWh. These developments will continue based on concerns over climate change and the need to reduce carbon emissions. This will affect the options for energy for biscuit baking.
FIG 2 After Lazard
Renewable energy became the biggest source of electricity in the European Union in 2020 reaching 38% of the total electricity generated. For several individual countries, it is now the main source of electricity, including the United Kingdom, Germany, and Spain. In the United Kingdom, 54% of electricity came from low carbon sources. In 2020 renewable energy sources accounted for 12% of the total energy consumption and 20% of electricity generation in the USA.
Japan’s government has pledged to increase renewable sources, solar and wind, for electricity generation from 10% in 2018 to 22-24% by 2030.
The Renewable Energy Master Plan (REMP) for Nigeria seeks to increase the supply of renewable electricity from 13% of total electricity generation in 2015 to 23% in 2025 and 36% by 2030. Renewable electricity would then account for 10% of Nigerian total energy consumption by 2025. REMP targets higher electrification rates, from 42% in 2005 to 60% in 2015 and 75% by 2025.
In a number of countries in Asia Pacific, Latin America and Africa energy from biomass contributes a significant source of energy with low carbon dioxide emissions. The most common biomass materials used for energy are plants, such as corn and soy and wood. The energy from these materials can be burned to create heat or converted into electricity. Some coal fired power stations are now being converted to burn biomass.
FIG 3 Increase in energy from renewables 2019 - 2025
From International Energy Agency. www.iea.org
Renewables will become the largest source of energy by 2025, surpassing coal.
It is predicted that electricity will in the future be a preferred energy for many industries, based on competitive costs with current gas supplies and the need to reduce reliance on fossil fuels. In addition electricity is a clean and easily controlled energy source. Electric baking ovens have the following features:
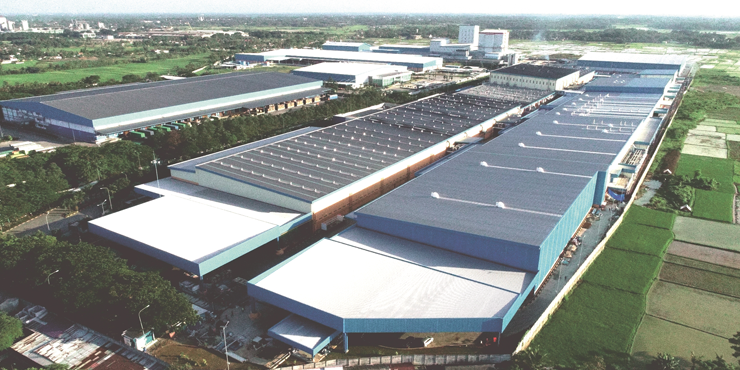
Modern biscuit bakeries have long flat roofed production areas. The image above is an example of modern bakery design. New bakeries now often have production areas of around 150m x 30m, 4,500m2. This area could be used for solar panels.
FIG 5 Solar panels Photo by MICHAEL WILSON on Unsplash
A bakery roof of 4,500m2 could support 2000 solar panels of 96cells and 350W capacity for each panel. The panel size is 1.90m x 1.0m.
Energy = solar panel watts x average hours of sunlight per year x 0.75
0.75 typical efficiency factor. Hours based on mid-Europe: 2000 hours per year
Calculation:
350 W x 2000 hrs x 0.75 = 525,000W per year per panel
525 kWh/panel x 2000 panels = 1,050,000kWh per year
Vivint Solar www.vivintsolar.com
Power requirement for a production line:
Average power requirement for producing 1000kg of cracker, semi-sweet and short dough biscuits: 509kWh
Our 2000 solar panels would power the production line for approximately 2000 hours.
Average hours of sunlight per year:
REFERENCES
Leading image source: New PT Mayora Indah bakery in Indonesia with solar panels
CEIC Data. www.ceicdata.com 2021
Center for Climate and Energy Solutions. www.c2es.org 2021
Energy Post.eu www.energypost.eu 2021
Global Solar Atlas. www.globalsolaratlas.info/map 2021
International Energy Agency. www.iea.org 2021
IN HABITAT 909 N. Pacific Coast Highway, 11th Floor, El Segundo, CA 90245, USA. https://inhabitat.com 2021
IPCC. Intergovernmental Panel on Climate Change. www.unfoundation.org/climate/panel 2021
Lazard. www.lazard.com 2021
NFPA Committee Input No.48 – NFPA 87-2012 www.nfpa.org 2021
Nuclear Energy Agency. www.oecd-nea.org/lcoe 2021
Our World in Data www.ourworldindata.org 2021
Photovoltaic Software www.photovoltaic-software.com 2021
Photonic Universe www.photonicuniverse.com 2021
Statista. www.statista.com 2021
Testo Inc. Applications Guide Rev. 1.0. 2006. www.testo-international.com 2021
Thermowatt DhE www.thermowatt.com www.dhesrl,com 2021
The Engineering ToolBox. www.engineeringtoolbox.com 2021
UK Power www.ukpower.com 2021
Vivint Solar www.vivint.com 2021
Watlow. www.watlow .com 2021
World Bakers www.worldbakers.com 2021