

What Can OEE - Overall Equipment Effectiveness - Do for You?

Like & comment
Related articles

Unlocking the Power of Sorghum: Indigenous Cereal Innovation for Diverse and Sustainable Biscuits
Discover how indigenous sorghum is reshaping biscuit innovation by offering a nutritious, gluten-free alternative to wheat flour.
May 21, 2025
Our experts

An Economic Analysis of AI: Insights & Recommendations
An examination of a recent AI economic study from MIT and and its implications for the food and beverage industry.
Feb 13, 2025
Our experts

Strategies for Managing Enzyme Applications in Babies Biscuits
Addressing baby biscuit formulation: balancing nutrition, texture, safety, and digestibility for optimal development
Sep 09, 2024
Our experts
Featured products

Ammeraal Beltech
Dectyl Food Grade synthetic belts: making food production safer!
Available in two versions - a matt finish for non-stick release properties and a glossy variant tailored for high-grip positioning - Dectyl...
SCHALLER Solutions
Chocolate Cooling Tunnel
G-CT Chocolate Cooling Tunnel
A tunnel designed for cooling products out of the chocolate coating machine.
Water or air cooling, produ...
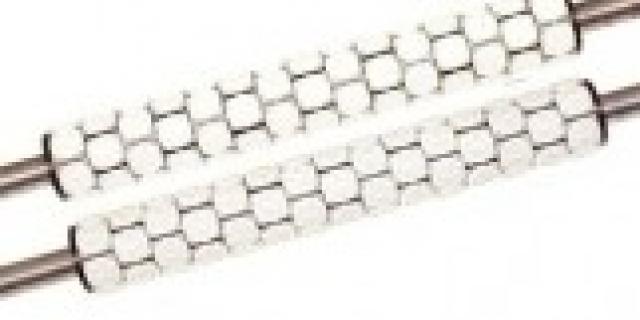
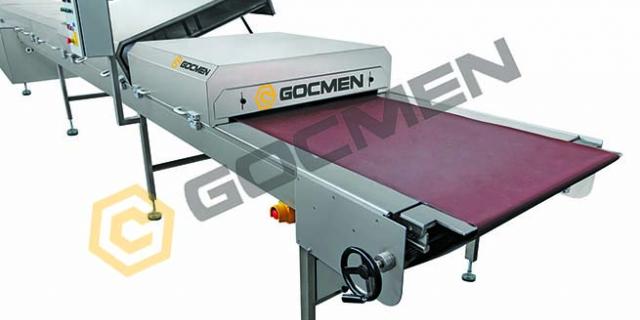
Errebi Technology
Rotary Cutters
The Errebi rollers with interchangeable rings for rotary moulding machines were developed through fine precision work.
They guarantee per...

BENEO
TWP (Textured Wheat Protein)
After hydration textured wheat protein offers a meat-like texture and is therefore used for partial or complete meat replacement. One part o...
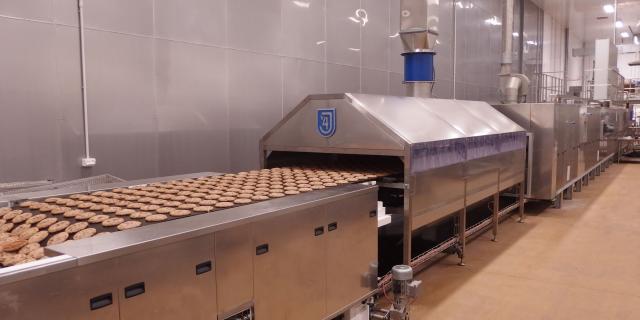
J4 Tunnel Ovens
Customized tunnel oven
J4 Tunnel Ovens build ovens for masters of their craft. Customizing is main reason, why hundreds of customers around the world are choosing...

Baker Pacific Ltd
Biscuit Baking Technology: Processing and Engineering Manual, Third Edition
Shares over 50 years of experience in the biscuit baking industry world-wide, and is the most updated reference book for senior managers and...
Featured questions


Featured companies

Ammeraal Beltech
Whether it's biscuits, cookies, snacks or other baked items, we have SAFE & CLEAN Bakery Belts for a...
Netherlands

SCHALLER Solutions
SCHALLER, with 36+ years of expertise, delivers turnkey food factories and cost-effective wafer/choc...
Austria

Errebi Technology
Looking for quality moulding equipment? Errebi Technology is a world-famous Italian company making r...
Italy