answer caret-left caret-right close-large facebook hamburger linkedin mail password question repeat-password thumb triangle twitter username youtube circle-right trending search checkmark pin alert

Consumer Acceptance and Preference Of New Chocolate and Vanilla-Flavoured Wafer Products
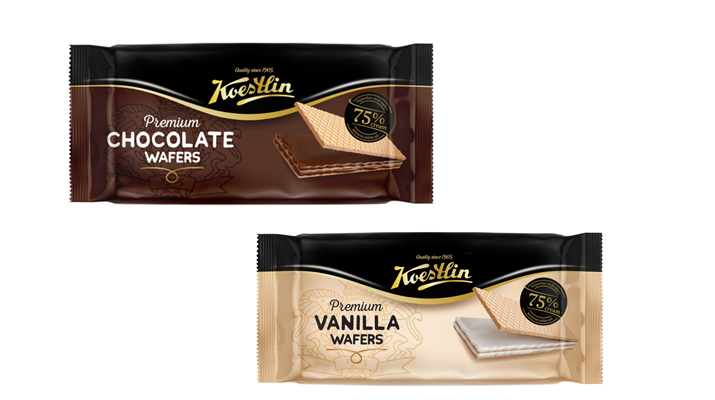
Consumer Acceptance and Preference  Of New Chocolate and Vanilla-Flavoured Wafer Products

A study on consumer preference and acceptance towards buying reformulated wafers

Abstract

            This study has been conducted within the framework of the project Development of a New Category of Wafers with a Different Nutritional Composition Excluding the Use of Palm Fat and Their Effects on Consumer Digestion, co-funded by the European Regional Development Fund of the European Union, with the aim of exploring consumer acceptance and preference of new Premium Wafer products with chocolate and vanilla-flavoured products.

            The research began with the development of quantitative and qualitative descriptors for all sensory properties characteristic of the products carried out by sensory assessors in the Sensory Evaluation Laboratory at the Faculty of Food Technology and Biotechnology using the quantitative descriptive analysis method.

            Consumer testing involved a group of 489 subjects from 4 different populations, with a balanced representation of the two genders, three different age groups and four education levels where possible.

            The following methods were used: survey (to collect data on the socioeconomic status of the subjects and their habits in terms of consumption of confectionery products and food-purchasing behaviour in general); 9-point hedonic scale (for 4 sensory properties as well as the overall impression); JAR scale (also for to 4 sensory properties); ranking test.

            The results of the study have been used as a basis for drawing a number of conclusions, with the most important ones being that all consumers like both products regardless of flavour (chocolate or vanilla) very much, that the sensory properties of the products are ideal for the most part, and that the products made with coconut fat score higher then the products made with palm oil in terms of consumer preference.

Introduction

            Palm oil is one of the most commonly used vegetable oils in the world. It is used as biofuel, for frying or roasting, as a bakery fat, including in the production of biscuits and snacks,  in margarine, as added fat in infant milk formulas, and it has also found application in the cosmetic industry. It has achieved such widespread use in the food industry due to its favourable technological properties, like its stability at high temperatures due to fatty acid composition and presence of antioxidants, and its favourable effect on product texture without affecting odour or taste (Kadandale et al., 2019). The validity of arguments in favour of palm oil consumption has been questioned due to its negative impacts on consumer health and food safety, the environmental impact of its production and the sustainability issues relating to its cultivation in the countries of origin. Various compounds formed during the palm oil refining process, such as 3-monochloropropane diol (3-MCPD) and its glycidyl esters (GE), have also been found in the processed foods containing palm oil. As regards its health impacts, palm oil has been associated with cardiovascular disease risk and cancer risk (Gesteiro et al., 2019; Arnett et al., 2019). The European Food Safety Agency has established the maximum tolerable daily intake for the aforesaid contaminants and issued a report stating that the quantities of harmful substances in such products are considered safe for most adults, but that there are concerns regarding children and younger age groups who are most exposed to such substances (EFSA, 2018).

           Because of the controversies surrounding the production and safe consumption of palm oil, the food industry has been turning to other fat sources like coconut oil, shea butter or cocoa butter (GCCR, 2018; Gesteiro et al., 2019). 
           Over the last few years, coconut oil has been mentioned in the context of “magical” foods because of its reported health benefits, even though it contains 90% saturated fats. The major fatty acids of coconut oil are medium-chain fatty acids (lauric acid), which behave differently than long-chain fatty acids from a metabolic standpoint (Wallace, 2019). Reusing coconut oil for frying is not recommended. Its reported health benefits include weight loss, lowering cholesterol levels, prevention and treatment of Alzheimer’s disease, prevention of dental caries, topical use for prevention and treatment of atopic dermatitis, anti-inflammatory and antimicrobial effects (Wallace, 2019; da Silva Lima and Block, 2019; Neelakantan et al., 2020). What is certain and what the consumers should bear in mind is that coconut oil has the highest level of saturated fatty acids among all vegetable oils and should be consumed according to the recommendations. 

Material and Methods of Study

          Premium Wafer with chocolate 

The research involved 489 consumers/subjects and 7 sensory analysts.

            Sensory evaluation of new product samples - Premium Wafer with chocolate (code number 242) and vanilla-flavoured Premium Wafer (code number 124) - was carried out by a sensory panel (ISO 8586:2012; ISO 8589:2007). For research purposes, certain existing products that were already available on the market have also been supplied: Choco Layered Wafers (code number 576) and Vanilla Layered Wafers (code number 707); these products were used to carry out a preference assessment for the new products compared with the existing products. Immediately upon receipt, product samples were stored in accordance with the instructions for storage for the relevant product category.

            The sensory profile of the new products has been developed by sensory analysts using quantitative descriptive analysis (Meilgaard et al., 2016).

              In the group of acceptance tests, the overall liking of the products and the liking of their specific sensory properties have been assessed using a 9-point, verbal, hedonic scale (Lawless and Heymann, 2010). The JAR scale (Just about Right) from the same group of consumer tests was used to measure consumer response to specific sensory properties. This scale is bipolar, its endpoints are opposites and its centre point is labelled “just about right” (Lawless and Heymann, 2010). In the group of preference tests, the preference ranking test (ISO 8587:2006) was used.

            Prior to investigating the opinions of consumers related to preference and acceptance of new products, sociodemographic data and information on the subjects’ dietary habits have been collected, with survey questions taken from similar market research surveys on consumer food preferences and habits (Lawless and Heymann, 2010).

Premium Vanilla wafers 
Results

Table 1. Sociodemographic characteristics of study subjects

Characteristics

Categories

Total

Sample 242

Sample 124

Gender

Female

53%

56%

50%


Male

47%

44%

50%

Age groups

< 35

55%


35-55

34%


> 55

11%


Marital status

Married

41%

40%

43%


Not married

59%

60%

57%

Employment status

Unemployed

2%

2%

2%


Student

31%

35%

26%


Employed

65%

61%

71%


Retired

2%

2%

1%

Education level

Secondary school

49%

52%

46%


University/bachelor

15%

14%

17%


University/master

22%

21%

21%


MSc/PhD

14%

13%

16%

Household size

1 member

9%

8%

9%


2-3 members

41%

41%

41%


4-5 members

44%

45%

44%


More than 5 members

6%

6%

6%

Income

< HRK 5,000

11%

10%

12%


HRK 5-10,000

34%

34%

34%


> HRK 10,000

55%

56%

54%

Table 2. Dietary habits of study subjects

Dietary habits

All

Women

Men

Sample 242

Sample 124

Omnivore

92 %

92 %

92 %

93 %

90 %

Vegetarian

1 %

1 %

1 %

2 %

1 %

Vegan

0 %

0 %

0 %

0 %

0 %

Other

7 %

7 %

7 %

5 %

9 %

Table 3. Consumption of wafer products

Structure

Decision (YES/NO)

Share (%)

All

Yes

91%


No

9%

Women

Yes

91%


No

9%

Men

Yes

90%


No

10%

Table 4. Frequency of consumption of wafer products

Structure

Frequency

Share (%)

All

Every day

1%


2-3 times/week

17%


Once/week

22%


2-3 times/month

23%


Once/month

20%


Several times/year

17%

Women

Every day

0%


2-3 times/week

15%


Once/week

20%


2-3 times/month

25%


Once/month

24%


Several times/year

16%

Men

Every day

1%


2-3 times/week

20%


Once/week

25%


2-3 times/month

20%


Once/month

15%


Wafer cookies quality

Wafer cookies packiging

Wafer Cookies Price
Figure 1. Importance of specific factors influencing food purchasing decisions for a) all subjects, b) women, c) men
Profile of Premium Wafer products - sensory
Figure 2. Sensory profile of Premium Wafer products: wafers with chocolate and vanilla-flavoured wafers

Table 2. Consumer preference: wafer products with chocolate


Population

Samples of wafers with chocolate

Critical value for the Sign Test (α=0,05)

Significant difference

242 (k242)

576 (k576)


ALL SUBJECTS (N=270)

162

108

118

YES

    women (N=151)

86

65

63

NO

    men (N=119)

76

43

48

YES

k-value – number of times the product was ranked first in terms of preference (i.e. most preferred)

Table 3. Consumer preference; vanilla-flavoured wafer products


Population

Samples of vanilla-flavoured wafers

Critical value for the Sign Test (α=0,05)

Significant difference

124 (k124)

707 (k707)


ALL SUBJECTS (N=219)

147

72

94

DA

    women (N=109)

73

36

44

DA

    men (N=110)

74

36

44

DA

k-value – number of times the product was ranked first in terms of preference (i.e. most preferred)

sensory propertis wafer

wafer cookies statistics

Subject responses to specific sensory properties of the wafer product with chocolate by a) colour, b) texture

Subject responses to specific sensory properties of the wafer product with chocolate by a) colour, b) texture, c) odour, d) aroma

Subject responses to specific sensory properties of the vanilla-flavoured wafer product
Wafer cookies graph - preference
Discussion

            Even though there were more consumers who tried the wafer product with chocolate, the number of women and men who tried both products was about the same; similarly, both genders were more or less equally represented in the study (F: 53%; M: 47%). As regards age structure, the younger age group (under 35) was the largest group with 55% of the total number of subjects, followed by the middle age (34%) and the older age group, i.e. over 55 (11%). Age distribution was similar for both genders. The ratio of unmarried to married subjects was 59% to 41% of the total number of subjects, as well as within groups of subjects divided by gender or the type of product tried. On average, employed persons make up 65% of the total number of subjects, as well as when divided by gender or the type of product tried. Students constitute the second largest group, followed by unemployed persons and retirees with an average of 2%. On average, the share of high school graduates was 49% of the total number of participants, as well as within groups divided by gender or product tried. Subjects holding first cycle university degrees are the second largest group (on average 37%), followed by Masters and/or Doctor of Science (14%). Distribution according to education level is similar in the total number of subjects and within groups divided by gender or the type of product tried.  The number of subjects from households with 2-3 members and households with 4-5 members is similar (41% and 44%, respectively). The distribution within groups divided by gender and by the type of product tried is the same. Income level is related to the size of the household; on average, 55% households report income in the HRK 5-10,000 category. The share is almost the same within groups divided by the type of product tried or by gender (Table 1).

            With regard to dietary habits, 92% of the subjects are omnivores. The percentage of omnivores within groups divided by gender or the type of product tried is the same (Table 2).

            As regards wafer consumption, 91% of subjects consume wafer products, irrespective of their gender. In this study, the reported frequency of wafer product consumption by percentage share encompasses three categories (2-3 times/week, once/week and 2-3 times/month, Table 3).

            Specific factors that contribute to the selection of products, like quality, sensory properties, packaging, brand, price, availability and advertising, have been classified as “not at all important”, “slightly important”, “important”, “rather important” or “extremely important” for the buying decision process. Product quality and sensory properties are perceived as “extremely important” by all subjects, regardless of gender. All subjects rate packaging as “important” when making buying decisions. The brand is “important” or “fairly important” for everyone, as the price and availability. The effect of advertising has been classified as “important” or “slightly important” by all subjects regardless of gender (Figure 1).

            The sensory profile of the new products - wafers with chocolate and vanilla-flavoured wafers - has been described using 19 sensory properties from the appearance, aroma, flavour, and texture categories. The colour of the wafer sheets and the filling of the premium wafer product with chocolate was characteristic, the filling was uniform and evenly spread between wafer sheets with a characteristic layer thickness, and visible crispy properties were pronounced. The presence of artificial chocolate aroma or flour odour was not noticeable. The aroma was medium sweet, with a distinctive smell of chocolate. As regards the flavour, the product had an ideal balance of sweetness, without sourness or noticeable bitterness. No artificial chocolate flavour is present. Texturally, the product is not tough; its chewiness is ideal, its crispness during biting and chewing is also ideal, it has a slightly more pronounced firmness, medium oiliness, and slight graininess. The colour of the wafer sheets of the premium vanilla-flavoured wafer product was characteristic, but perhaps a shade lighter than standard, the colour of the filling was typical and ideal, the filling was uniform and evenly spread between wafer sheets with a characteristic layer thickness, and visible crispy properties were pronounced. The presence of artificial vanilla aroma or flour odour was not noticeable. The aroma was intensely sweet, with a less pronounced vanilla scent. As to the flavour, the product has an ideal balance of sweetness, with a slight sourness and without bitterness. No artificial vanilla flavour is present. Texturally, the product is not tough; its chewiness is ideal, its crispness during biting and chewing is also ideal, as well as its firmness, it has a barely perceptible oiliness and graininess (Figure 2).

            As regards consumer preference, all subjects, as well as groups of subjects divided by gender, prefer both new products made with coconut fat, with statistically significant differences in the preference in favour of the new product for all consumers, except for female subjects and wafer products with chocolate (Tables 5 and 6)

            The results regarding the overall liking of the new products for all subjects and by gender were obtained using a 9-point hedonic scale. Both products scored high on all sensory properties, with the vanilla-flavoured product scoring better than the chocolate wafer in general. With regard to all sensory properties, women like both products more than the male population. Men ranked the colour and texture of chocolate wafers higher than the colour and texture of vanilla-flavoured wafers (Figure 3).

            The response of all subjects and of the groups of subjects divided by gender to the sensory attributes of colour, texture, odour, and flavour of both wafer products is shown on the JAR scale. According to all subjects and the groups of subjects divided by gender, colour, texture, and aroma of chocolate wafers are “ideal”. According to all subjects, the odour is less pronounced (Figure 4). All 4 sensory attributes of vanilla-flavoured products were classified as “ideal” by all subjects as well as by groups of subjects divided by gender (Figure 5).

Conclusions

The results obtained in the study show a pronounced, i.e. statistically significant consumer preference for the new products, regardless of gender. The average liking scores for specific sensory attributes and the overall liking of both products is high, which guarantees strong market positioning. The premium vanilla-flavour wafer product scored higher for the overall liking and the liking of most specific sensory attributes than the premium wafer products with chocolate.

 Additionally, the average liking score awarded by women is higher than the score awarded by men. All sensory attributes of both products are ideally balanced, except for the odour of the wafer product with chocolate, which is less pronounced.


Authors

Nikolina Plentaj, mag.ing.techn.aliment., Technical Director, Koestlin d.d. Tvornica keksa i vafla, Slavonska cesta 2a, HR-4300 Bjelovar

Sanja Kalšan, mag.ing. bioprocess engineering, Director of Laboratory Quality Control, Koestlin d.d. Tvornica keksa i vafla, Slavonska cesta 2a, HR-4300 Bjelovar

Eva Pavić, univ. spec. techn. aliment., Head of Food and Dietetics Department, University Hospital Centre Zagreb, Kišpatićeva 12, Vila prizemlje, HR-10000 Zagreb

Zrinka Šmuljić, mag. nutr.,  Food and Dietetics Department, University Hospital Centre Zagreb, Kišpatićeva 12, Vila prizemlje,  HR-10000 Zagreb

Prof. Nada Vahčić, PhD, Department for Food Quality Control, Faculty of Food Technology and Biotechnology, University of Zagreb, Pierottijeva 6, HR-10000 Zagreb

References

Arnett, D.K., Blumenthal, R.S., Albert, M.A., Buroker, A.B., Goldberger, Z.D., Hahn, E.J., Himmelfarb, C.D., Khera, A., Lloyd-Jones, D., McEvoy, J.W., Michos, E.D., Miedema, M.D., Muñoz, D., Smith, S.C. Jr, Virani, S.S., Williams, K.A. Sr, Yeboah, J., Ziaeian, B. (2019) ACC/AHA guideline on the primary prevention of cardiovascular disease: a report of the American College of Cardiology/American Heart Association Task Force on Clinical Practice Guidelines. Circulation 140, 596–646.

The Conference Board. (2018).Global Consumer Confidence Report 2018. 
<https://www.nielsen.com/wp-content/uploads/sites/3/2019/04/TCB-Global-Consumer-Confidence-Report-Q2-2018.pdf>. Accessed on 8 April 2020.

EFSA Panel on Contaminants in the Food Chain (CONTAM). (2018) Update of the risk assessment on 3-monochloropropane diol and its fatty acid esters, EFSA Journal 16, (1) 5083.

Gesteiro, E., Guijarro, L., Sánchez-Muniz, F. J., Vidal-Carou, M., Troncoso, A., Venanci, L., Jimeno, V., Quilez, J., Anadón, A., González-Gross, M. (2019) Palm Oil on the Edge. Nutrients 11, (9) 2008.

Kadandale, S., Marten, R., Smith, R. (2019) The palm oil industry and noncommunicable diseases. Bull. World Health Organ. 97, 118-128.

Lawless H. T., Heymann, H.: Sensory Evaluation of Food. 2nd Ed., Springer Science+Business
Media LLC New York 2010.

Meilgaard, M. C., Civille, G. V., Carr, T. B.: Sensory Evaluation    Techniques.
5th Ed., CRC Press, Taylor & Francis Group, Boca Raton, London, New   York, 2016.

Neelakantan, N., Hoong Seah J.Y., van Dam, R.M. (2020) The Effect of Coconut Oil Consumption on Cardiovascular Risk Factors. A Systematic Review and Meta-Analysis of Clinical Trials. Circulation 141, 803-814.

da Silva Lima R., Mara Block, J. (2019) Coconut oil: what do we really know about it so far? Food Quality and Safety 3, 61–72.

ISO 8586:2012 Sensory analysis — General guidelines for the selection, training and monitoring of selected assessors and expert sensory assessors

ISO 8587:2006 Sensory analysis – Methodology – Ranking

ISO 8589:2007 Sensory analysis — General guidance for the design of test rooms

ISO 11136:2014 Sensory analysis – Methodology – General guidance for conducting hedonic tests with consumers in a controlled area.

Wallace T.C. (2019) Health effects of coconut oil-a narrative review of current evidence.              
J. Am. Coll. Nutr. 38, 97-107.

Want to know more?
Ask industry experts in Biscuit People TechTalks section.
Read more from Our experts
Read all
Climate Change - Our Carbon Footprint
in
Our experts
Gas has been and continues to be the predominant fuel for biscuit baking ovens world-wide. The combustion of natural gas is a major source of greenhou...
Maximizing Comfort and Savings With Spot Cooling in Bakery Industry
in
Our experts
Spot cooling is a type of cooling system that focuses on cooling specific areas, rather than cooling an entire space. This can be achieved using porta...
Snack Cracker Innovation Using Sorghum
in
Our experts
In recent years, there has been a growing demand for healthy, gluten-free snacks in the food industry. One innovative approach to meeting this demand...
Looks like you don’t have a subscription to do that. Want to upgrade?
Upgrade subscription